Options Play FAQ

SogoPlay is a combination of resources to support our client’s evaluation of the equity markets with an emphasis on how stock options can be a meaningful complement to many equity strategies.
These resources are integrated from the underlying stock analysis to strategy evaluations through trade execution on Sogo’s trading platforms. This precludes the need to develop an idea with an investment analysis tool and have to manually transfer the strategy details into a trade platform for execution. All of these features are integrated and transparent.

What are Trade Ideas?

Trade Ideas are stocks that our scans identify each night after the market close. Our scans determine which stocks have the greatest chance of making an above-average move, either up or down, within the next few days or weeks.

How are Trade Ideas Generated?

Every trading day after market close, OptionsPlay analyzes thousands of US stocks using our proprietary scans to identify stocks poised for an imminent move up or down.

How do I find a good Trade Idea?

You can sort through the Trade Ideas based on your preference of sentiment (bullish or bearish), market capitalization (size of the company), the company's sector and the technical scan.You may also look at the Trade Ideas based on the Technical Score as well.

You can filter the Trade Ideas by sentiment (whether you are bullish or bearish), the market capitalization (size of the company), sectors, technical scans, company name (alphabetized), price of the stock, and technical score. If you click on the respective fields, you will notice the list being filtered. Here is an example: We filtered out this stock by clicking on bullish, clicking on Medium Cap, changing the sector to Basic Materials, and changing the scan to a CCI Dip in Bullish Trend.

customize the chart

What is the Technical Score?

This methodology is proprietary and cannot be defined in great detail, however, we can divulge that the SogoPlay’s technical score is derived by using a number of technical indicators over a variety of time periods. Since analytics on longer time periods are more reliable these are given greater weight. A raw score is generated and this score is presented in deciles giving the lowest 10% of the raw scores a Technical Score of 1 and the highest 10% a score of 10.

This Technical Score is a summary of short, medium, and long term indicators to help evaluate the performance of the stock. It is measured on a scale of 1-10 with 10 being the strongest bullish candidate and 1 being the strongest bearish candidate. Stocks with values 1-3 are weak stocks, generally in a bearish trend, that are potential sell candidates. Stocks with values 4-6 lack any strong trend and exhibit weak momentum. Stocks with values 7-10 are strong stocks, generally in a bullish trend, that are potential buy candidates.

What is the Options Play Score?

The OptionsPlay Score is a proprietary indicator evaluating the strategy and letting you know whether the level of risk you are taking is appropriate for the reward you may receive. An OptionsPlay score below 100 means you are potentially taking too much risk. Adjusting the expected trading range of the stock may adjust the score.
The core metric is presented as a value of a probability weighted risk / reward ratio based on a 1 Standard Deviation move either up or down in the underlying stock price. This metric represents the “expected” trading range with equal move up and down and does not have a direction bias and accounts for the payoff of the strategy within that range only. However, the user is given the ability to change the range of Standard Deviation from for example 1 to 2 Standard Deviations thus presenting a recalculation each time the range is changed.
It is essential to remember that the Options Play Score is based on a default 1 Standard Deviation or a user defined expectation of the performance of a stock by revising the Standard Deviation. This is not a measure of whether or not a trade is “good,” nor is it a predictive indicator about the ultimate outcome of the stock’s performance.

customize the chart

How do I view a stock that is not in the Trade Ideas list?

You can type in any company's ticker symbol in the Ticker Symbol Lookup above the chart. We provide the same fundamental information and Price Action analytics as our Trade Ideas.

How do I draw indicators and technical studies on the chart?

To add an indicator or technical study, you will need to expand the chart by clicking the arrows in the upper right hand corner of the chart and click on the "Studies" drop down box. From there you will see 65+ different technical studies and indicators.

Can I customize the chart?

You can customize the chart by type (Candle, Bar, Colored Bar, or Line), 1 month, 3 month, or 6 month periods, and 65+ different technical studies and indicators.

Where can I find the support and resistance levels?

The support and resistance levels can be found on the chart, denoted by the green (support) and red (resistance) lines on the chart. They are also displayed below the chart in the form of numbers and percentages.
Support is the price level of a stock where demand is thought to be strong enough to prevent the price from declining further. Resistance is the price level of a stock where selling is thought to be strong enough to prevent the price from rising further. A stock trading near its support level with an OptionsPlay sentiment of Bullish is a good candidate for a Bullish trade.

What does the 1m/6m trend indicator tell me?

The 1-month and 6-month trend indicators represent the current trend of the security over short-term and long-term. When these two indicators are aligned (either turn Bullish (Green) or Bearish (Red)), it provides a clear signal of the overall trend of a security's performance.

trend indicator

How do I take advantage of a Trade Idea?

After you have chosen and analyzed the stock you wish to trade, we provide you with up to three different strategies to choose from.
Those three strategies include buying/selling the stock, buying/selling a call/put, and buying/selling a call/put vertical. You may also choose from one of our 40+ pre-built strategies.
To take advantage of these strategies, you should look at the OptionsPlay score and the Strategy Analysis to determine the optimal trade.

How do I know how much risk I am taking for each trade?

You can find what you are risking in each trade by clicking on the OptionsPlay score to flip the panel. Once the panel is flipped, you can compare the Cost of the trade, the Max Risk, the Max Reward, Probability of Profit (POP), Breakeven Point, and Days Till Expiration.
Or, you can view the risk profile under the 'Plain English' Panel on the second dot on the Trading and Income Panel carousel.

Risk

What is POP?

POP stands for "Probability of Profit." It is simply the likelihood that this trade will be profitable. Essentially, the higher the POP, the greater the chance that the position will be profitable by at least $0.01 by expiration.

How is Probability of profit calculated?

POP- Probability of Profit is the probability of an options strategy resulting in at least $0.01 of profit upon expiration. OptionsPlay uses a probability tree derived from the current implied volatility of each underlying in determining the probability of an options strategy being above/below its breakeven price on the expiration date. It can also be interpreted as the probability of “being in the green” on the P&L chart of the option strategy.

What is POW?

POW stands for "Probability of expiring Worthless." It is simply the likelihood that the trade will expire worthless. The higher the POW, the lower the chance that the position will expire In-The-Money. POW is provided on the Income Tab and used for Covered Calls and Short Puts.

Where do I see the breakeven of a particular strategy?

The breakeven of a particular strategy can be found by submitting the order to Sogotrade’s Trade page and viewing the snapshot P/L graph on the upper right the Trade page. You must choose the P/L calculator for this window.

Risk

You could also then go to the dedicated P/L Calculator page for a very detailed breakdown of the desired trade.

Risk

How do I edit or modify a trade?

If you click on the OptionsPlay score to flip the panel, you can click on the edit trade button. After you click on it, the bottom part of that panel changes and you can edit your trade any way you want.
You can also click the fifth dot on the carousel at the bottom of the Trading and Income Panel.

modify a trade

What is my P&L (Profit & Loss) for each strategy?

If you look at the 'P&L Simulator' at the bottom of the Trading and Income Panel, you will see your profit and loss for each strategy. You can then adjust the target price of the stock and the future date that you think the stock will reach that price. The P&L will then recalculate based on those inputs. The strategy with the highest profit potential will highlight, as below.

modify a trade

Are there any limitations in the Profit and Loss Simulator?

Yes, the Profit and Loss Simulator only displays the profit or loss for a 2 standard deviation move. The range therefore encompasses approximately 97% of expected moves.

Does SogoPlay include commissions and other trade fees in its presentation?

Yes, the commissions and fees are presented when the trade strategy is prepared for submission to the market in order verify.


modify a trade

Where can I find more details about each strategy?

You can analyze each strategy in further detail by clicking on the graph in the top section of the Trading Panel.
Also, on the bottom of the Trading Panel you will be able to click the arrow on the left or the right to see different simulators to help analyze the trade.

modify a trade

Where can I find even more detailed information on certain option strategies?

You can find more details on certain option strategies by visiting our Strategies section on the SogoOptions platform. http://optionscn.sogotrade.com/Strategies.aspx

modify a trade

How do I change the quantity of the strategies?

To edit the amount of contracts you want to trade, you will need to navigate to the 'Edit Legs' section on the Trading and Income Panel. You can either type in the quantity, or you can use the arrow to adjust the quantity.

How do I execute a trade?

To execute a trade, you can click on the trade button at the bottom of each strategy, or click on the top of each strategy where it says "BUY" or "SELL"
Your trade ticket will pop up to review your trade. Once you are ready to place a trade, you can trade the strategy by clicking on the "Submit" button.

modify a trade

This will bring you to the SogoOptions Trading platform with the strategy's legs pre-filled. You simply have to verify the type of order and price before sending it out to the marketplace.

modify a trade

What does the Income Tab do?

The Income Tab provides a different aspect of trading. It is for users who wish to generate income against a current stock or equity position as opposed to opening a new speculative position. Generating income can be achieved by either writing a covered call if you own the stock, or writing a short put if you do not own the stock. We provide you with all the aspects of the trades to make sure they are right for you.

What is the difference between a Covered Call and a Short Put?

A covered call is a short call position taken against stock you already own. The calls we recommend writing have a low probability of expiring in-the-money, which means there is a high probability you will keep the premium you receive for writing the call. The risk is that your stock could be called away if the option is in-the-money near expiration.
A short put is a position that gives you the obligation to purchase the stock at the strike price of the put. This is an alternative to placing a limit order to purchase stock, but you collect a premium for doing so. If the stock is above the strike price at expiration, you keep the entire premium. Typically, you must have enough cash to cover the cost of owning the stock at the strike price for your broker to allow this trade.

How can I trade a strategy that is different from the three suggestions?

OptionsPlay recognizes 40+ strategies. If you click on the 'Modify' button or go to the 'Edit Legs' panel, you can create any strategy you can think of, or use our Strategy Constructor to pre-load a strategy. We have organized them by sentiment for convenience.

 Execute a trade

How can I edit the premium for each trade?

You can edit the premium once you are on the option trade ticket on theSogoOptions platform.

How can I interpret the Strategy Analysis?

The Strategy Analysis is a key indicator that shows you a summary evaluation of the strategy. Through color and interpretive messaging you will see that the strategy is aligned with the current stock trend and current market trend. It will show your risk/reward ratio, if there is sufficient liquidity, and will notify you of any upcoming earnings releases.

 Strategy Analysis

What is Long Call?

If you buy a call, you have the right (not the obligation) to purchase the underlying security at the strike price on or before expiration.

This is a bullish strategy because you want the price of the underlying security to be above the strike price by expiration. If this happens, your profit will be the difference between the price of the underlying security and the strike price, minus the premium paid for the call option.

 Strategy Analysis

What is Short Call?

If you write, or sell a call, you have the obligation (not the right) to sell the underlying security at the strike price, if assigned.

This is a bearish strategy because you want the price of the underlying security to be below the strike price by expiration. If this happens, the option will expire worthless and your profit will be the premium you received for selling the call option. This is a high risk investment strategy.

 Strategy Analysis

What is Long Put?

If you buy a put, you have the right (not the obligation) to sell the underlying security at the strike price on or before expiration.

This is a bearish strategy because you want the price of the underlying security to be below the strike price at expiration. If this happens, your profit will be the difference between the price of the underlying security and the strike price, minus the premium paid for the put option.

 Long Put

What is Short Put?

If you write, or sell a put, you have the obligation (not the right) to buy the underlying security at the strike price, if assigned.

This is a bullish strategy because you want the price of the underlying security to be above the strike price by expiration. If this happens, the option will expire worthless and your profit will be the premium you received for selling the put option. This is a high risk investment strategy.

 Short Put

What is Long Call Vertical?

A Long Call Vertical is a bullish strategy that consists of buying a call at a strike price and simultaneously sell a call at a higher strike price. The combination of these trades will limit the maximum reward, but will also minimize the risk incurred.

Any profit is "realized" if the price of the underlying security is above the break-even price of the vertical. Maximum profit is "realized" if the price of the underlying security is equal to or below the strike price of the short call.

Any profit is offset by the total premium paid. With a Long Call Vertical, the total premium paid (maximum risk) equals the premium paid for buying the long call minus the premium received for selling the short call.

 Long Call Vertical

What is Short Call Vertical?

A Short Call Vertical is a bearish strategy that consists of selling a call option at a strike price and simultaneously buying a call option at a higher strike price. The combination of these trades will limit the maximum reward available, but will also limit the risk incurred. Any profit is "realized" if the price of the security is below the break-price of the vertical. Maximum profit is "realized" if the price of the underlying security is equal to or below the strike price of the short call. In this situation, both options expire worthless. Maximum profit equals the premium received for selling the short call minus the premium you paid for buying the long call.

 Long Call Vertical

What is Long Put Vertical?

A Long Put Vertical is a bearish strategy that consists of buying a put option at a strike price and simultaneously selling a put option at a lower strike price. The combination of these trades will limit the maximum reward available but will also limit the risk incurred.

Any profit is "realized" if the price of the underlying security is below the break-even price of the vertical. Maximum profit is "realized" if the price of the underlying security is equal to or below the strike price of the short put.

Any profit is offset by the total premium paid. With a Long Put Vertical, the total premium paid (maximum risk) equals the premium you paid for buying the long put minus the premium received for selling the short put.

 Long Call Vertical

What is Short Put Vertical?

A Short Put Vertical is a bullish strategy that consists of selling a put option at a strike price and simultaneously buying a put option at a lower strike price. The combination of these trades will limit the maximum reward available, but will also limit the risk incurred.

Any profit is "realized" if the price of the underlying security is above the break-even price of the vertical. Maximum profit is "realized" if the price of the security is equal to or above the price of the short put. In this situation, both options expire worthless.

Maximum profit equals the premium received for selling the short put minus the premium paid for buying the long put.

 Long Call Vertical

Where can I learn more about Options?

You can visit our Option Education Center to learn more :

Understanding Option Greeks

When determining how options may react to a given change in some of the variable pricing inputs, investors turn to the Greeks for guidance. The most commonly used Greeks are Delta, Gamma, Theta, Vega, and Rho. Greeks are not a guarantee of exact option premium changes, but rather a theoretical guidepost that gives investors an estimate of an option's value when the underlying moves, interest rates or dividends change, time changes, or implied volatility changes. Most pricing models use the following inputs to determine theoretical values and the corresponding Greeks:

 Stock price
 Strike price
 Time to expiration
 Implied volatility
 Interest rate
 Anticipated ordinary dividends

Some of these variables, like implied volatility and stock price, change constantly during market hours while the stock price, interest rate and dividend assumptions may not change at all for the life of the contract.

Delta

Delta is a theoretical estimate of how much an option's premium may change given a $1 move in the underlying. For an option with a Delta of .50, an investor can expect about a $.50 move in that option's premium given a $1 move, up or down, in the underlying. For purchased options owned by an investor, Delta is between 0 and 1.00 for calls and 0 and -1.00 for puts. For sold options, as the investor essentially has a negative quantity of contracts, we find that short puts have a positive Delta (technically a negative Delta multiplied by a negative number of contracts); short calls have a negative Delta (technically a positive Delta multiplied by a negative number of contracts).
For example, the XYZ 20 call has a .50 Delta and is trading at $2 with XYZ stock at $20.50. XYZ rises to $21.50. The investor would expect that the 20 strike call would now be worth around $2.50 as seen below:

* $1 increase in underlying price x .50 Delta = $.50 anticipated change in option premium.
* Original Premium: $2.00 +$.50 estimated change = $2.50 estimated new premium after $1 stock price increase.

With a $1 move down in XYZ, the investor would expect to see this same 20 strike call option decrease in value to around $1.50. As the stock price rises and the call option goes deeper-in-the-money, Delta typically approaches 1.00 because of the increased likelihood the option will be in-the-money at expiration. As expiration approaches, in-the-money-option Deltas are also more likely to be moving slowly toward 1 because at expiration an option either has a Delta of 0 or 1.00 with no time premium remaining.

The picture below shows how you can incorporate Delta into your analysis:


Delta

Gamma

How Delta is expected to change given a $1 move in the underlying is called Gamma. An investor can see how the Delta will affect an option's price given a $1 move in the underlying, but to see how the Delta on that option might change given the $1.00 move, we refer to Gamma. Gamma will be a number anywhere from 0 to 1.00. Since Delta cannot be over 1.00, Gamma cannot be greater than 1.00 either as Gamma represents the anticipated change in Delta.

Looking at the hypothetical example, XYZ is trading at $50. The XYZ Jan 50 call is trading for $2, has a Delta of .50 and a Gamma of .06. Should XYZ go up to $51, an investor can estimate that the 50 strike call will now be worth around $2.50. The new Delta of this 50 strike call at an XYZ price of $51 should be around 0.56 (simply adding the Gamma of .06 to the old Delta of .50).

Theta

Both long and short option holders should be aware of the effects of Theta on an option premium. Theta is represented in an actual dollar or premium amount and may be calculated on a daily or weekly basis. Theta represents, in theory, how much an option's premium may decay per day/week with all other things remaining the same.

Theta or time decay is not linear. The theoretical rate of decay will tend to increase as expiration approaches. Thus, the amount of decay indicated by Theta tends to be gradual at first and accelerates as expiration approaches. Upon expiration, an option has no time value and trades only for intrinsic value, if any. Pricing models take into account weekends, so options tend to decay seven days over the course of five trading days. However, there is no industry-wide method for decaying options so different models show the impact of time decay differently. If a pricing model is decaying options too quickly, current markets may look too high when compared to the model's theoretical values, and if the model is displaying the decay too slowly, the current markets may look too cheap compared to the model's theoretical values.

If XYZ were trading at $50 and 50 strike call was trading at $3 with a Theta of .05, an investor would anticipate that option to lose about $0.5 per day, all things remaining the same. If a day passed without a change in the option price, then one of the other variables must have changed. In most cases, it must have been an increase in implied volatility. If the option decreased more than $.05 an investor might deduce that implied volatility on that strike or product might have dropped as well. And as expiration approaches, it is likely Theta would become increasingly negative. At the end of the second trading day, with one day left until expiration, the Theta should equal the entire amount of time value left in the option.

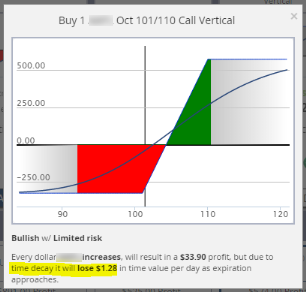
The picture below shows how you can incorporate Theta into your analysis:


Delta

Vega

Vega measures an option's sensitivity to changes in implied volatility. Implied volatility is measured in percentage terms and is a key variable in pricing models. Implied volatility has no direct correlation to actual past historical or statistical volatility; rather it is a measure of predicted future movement. Implied volatility tends to increase when there is uncertainty or anticipated news, while it tends to decrease in times of calm. Some investors use a stock's historical volatility as an indication of where implied volatility should be, but the market is the ultimate determining factor of current implied volatility levels. Also, Vega and implied volatility can change without any movement in the underlying.

If a large sell order came into the market and the price of the option declined due to lack of interested buyers at the current price, we would see a decline in the implied volatility if there were no change in the other assumptions. Increased demand and higher premiums mean an increase in implied volatility. Changes in implied volatility can also impact the other Greeks like Delta and Gamma so traders should be aware how the Greeks works together.

Vega measures the amount of increase or decrease in premium based on a 1% (100 basis points) change in the implied volatility assumption. Longer-term options tend to have higher Vega than near-term options. Longer-termed options are typically more expensive, and a 1% change in implied volatility will represent a larger dollar amount of that premium than an option with a lower premium. If XYZ were trading at $50 and the front-month 50 call was trading at $2 and the 12-month-out 50 call was trading at $5, the more expensive call would be more profoundly affected by a 1% change in implied volatility. To increase in price by identical amounts, the near-term option's implied volatility would have to have gone up around 2.5x that of the longer-termed option.

For example, XYZ is trading at $50, a call with 12 months until expiration has an implied volatility of 30%, a Vega of .15, and a current market value of $4. If implied volatility were to instantly rise 2% to 32%, the investor might expect the option premium to increase by: .15 x 2 = $.30 to around $4.30, all things being equal. A decrease in implied volatility by 5% may result in the option losing around: .15 x 5 = $.75 in value. As we can see, changes in implied volatility can have drastic effects on an option price, probably second only to underlying price in importance.

Rho

Rho is the measure of an option's sensitivity to interest rate changes. Similar to Vega, interest rate changes impact longer-term options much more than near-term ones. Interest rates are used in pricing models to take into consideration an option's price based on its "hedged value", the idea that an investor uses long or short stock to hedge (or manage risk associated with) options positions. Conversely, Rho is negative for purchased puts as higher interest rates decrease premiums.

For example, interest rates are currently 3.00% and Rho on a $100 call option is +.45, if interest rates suddenly went to 4%, the premium would rise by $.45. Conversely, if Rho for the put was -.45, the put premium would decline by $.45 per share. Of course this assumes the other pricing factors remain constant.

The higher the price of the stock and the longer time until expiration generally means a greater sensitivity to changes in interest rates (higher absolute Rho values). The cost of carrying a $250 stock position over time will be greater than that of a $50 stock. The longer the time frame the position is held, the greater the cost of money.

Volatility

Volatility can be a very important factor in deciding what kind of options to buy or sell. Historical volatility reflects the range that a stock's price has fluctuated during a certain period. The mathematical value of volatility is denoted as "the annualized standard deviation of a stock's daily price changes."

There are two types of volatility: statistical volatility and implied volatility.

Statistical (Historical) Volatility is a measure of past actual asset price changes over a specific period.

Implied Volatility is a measure of how much the marketplace expects the asset price to move based on price changes in an option. It is what the market is "implying" the volatility of the stock price might be in the future.